Equity Comp Decision Stack: ISOs, RSUs, NSOs, QSBS
Here's a scenario that's more common than it should be.
Senior engineer. $420,000 total comp. Three equity instruments: RSUs vesting quarterly at current employer, unexercised ISOs from a former employer whose 409A went up, and early startup stock that might qualify for QSBS. All three have decisions due before December 31.
She asked three different advisors. Got three different answers about three different instruments. None of them mentioned how the instruments interact. None of them modeled the full-year tax picture with all three in play simultaneously.
She made each decision independently. In sequence. The ISO exercise pushed her into AMT. The RSU vest added ordinary income that erased her LTCG rate on the QSBS sale. The total tax bill was $47,000 more than it needed to be.
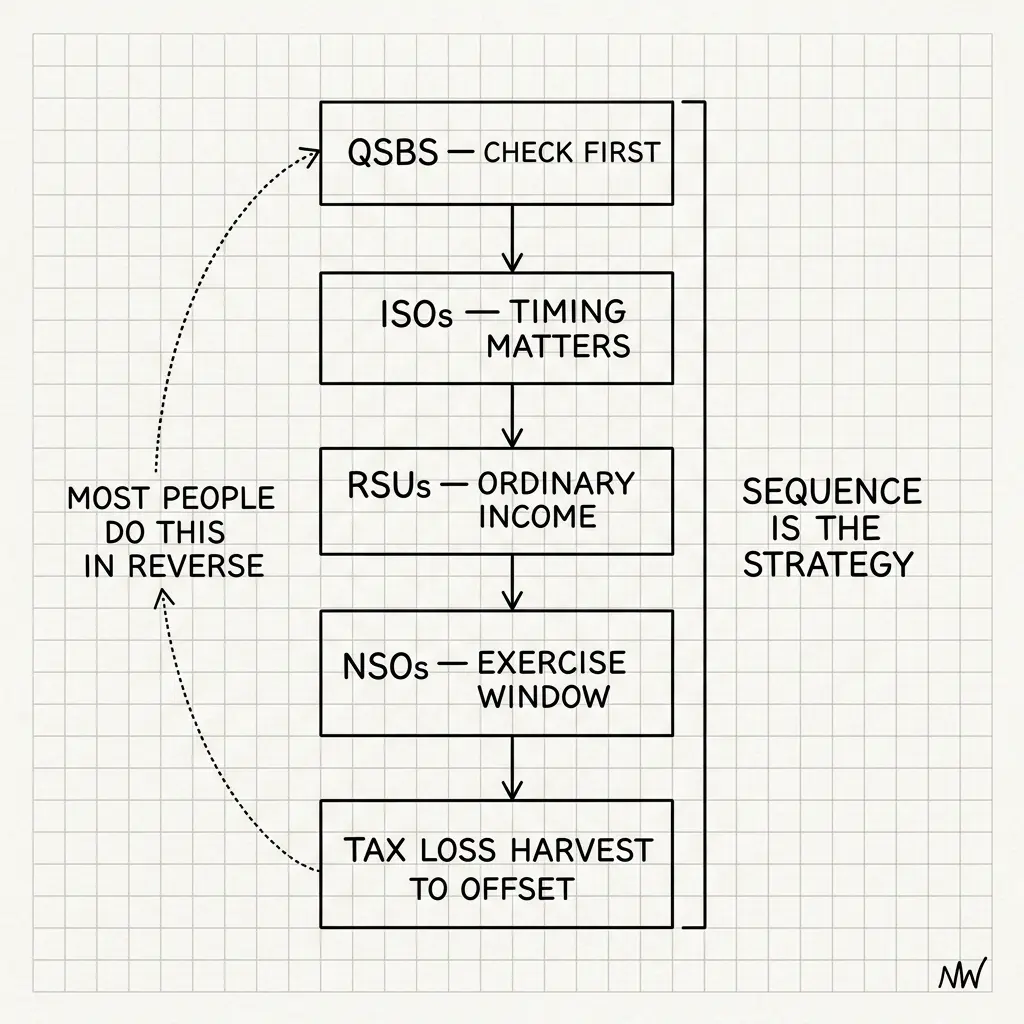
The instruments weren't the problem. The sequencing was.
Quick Answer
The Equity Comp Decision Stack is a priority ordering for equity compensation decisions that accounts for interaction effects. The right sequence: (1) QSBS holding period decisions first — they're time-bound and often irreversible, (2) ISO exercise planning before year-end — AMT exposure is calculated annually, (3) RSU vest disposition — sell/hold/same-day based on concentration and tax position, (4) NSO exercise timing if applicable, (5) tax-loss harvesting to offset any of the above, (6) retirement contribution sequencing last. Changing the order of any step changes the total cost.
The Instrument Map
Before building the stack, know what you're working with. Most HENRYs in tech have some combination of these:
RSUs (Restricted Stock Units)
Tax trigger: Vest date. Full vest value is ordinary income regardless of what you do next.
Decision window: Before each vest date (change disposition election). At vest date (same-day, sell to cover, hold).
Key variable: Withholding rate vs. marginal rate gap.
ISOs (Incentive Stock Options)
Tax trigger: Exercise (AMT preference) and sale (regular income or capital gain depending on holding periods).
Decision window: Any time the options are vested, but AMT exposure is annual — model it December by December.
Key variable: The "bargain element" (current 409A value minus strike price) and your current-year AMT exposure.
NSOs (Non-Qualified Stock Options)
Tax trigger: Exercise date. Spread between strike price and FMV is ordinary income at exercise, plus FICA.
Decision window: When to exercise — FMV trajectory, holding period for QSBS eligibility, liquidity event timing.
Key variable: Current-year income level (ordinary income stacks on W-2 income).
QSBS (Qualified Small Business Stock)
Tax trigger: Sale after 3-year minimum hold. Up to 100% federal exclusion at year 5, tiered 50%/75% at years 3/4.
Decision window: At issuance (early exercise decision), at year 3 (sell now vs. wait for higher exclusion), at liquidity event (stacking planning).
Key variable: Company gross assets at issuance (must be under $75M), current holding period, state tax conformity.
The Decision Stack (Priority Order)
Priority one is always the decision with the smallest reversibility window and the largest irreversible consequence. Work down from there.
Step 1: QSBS Holding Period Decisions
Why first: Time-bound and irreversible. The holding period clock only ticks forward. If your company's gross assets are approaching $75M, the window to create new QSBS shares may be closing. If you're approaching year 3 on existing shares, the Section 1045 rollover option arrives. If you're at year 5, 100% exclusion is available and any delay risks a company event that changes the calculus.
Questions to answer in Q3 of each year: What's the current company gross asset position? Am I approaching any holding period milestone (3/4/5 years)? Is a liquidity event likely before my next milestone? Should I early exercise any outstanding grants before the gross asset threshold is breached?
Step 2: ISO AMT Planning
Why second: AMT is calculated annually. Every ISO exercise creates a "bargain element" — the spread between the current 409A value and your strike price — that's an AMT preference item. But AMT has an exemption ($89,075 single / $138,450 MFJ in 2026, verify current figures) and begins phasing out above ~$620,000 AMTI. You may have more room to exercise ISOs this year than you think — or less.
The $100,000 ISO annual rule: Options are only ISOs (with their favorable tax treatment) to the extent their grant-date fair market value doesn't exceed $100,000 per year. Options granted above this threshold are treated as NSOs. Many people with large ISO grants don't realize portions of them are NSOs.
Questions to answer by October 31: What's my current AMT exposure if I exercise X shares today? Does exercising increase my total tax bill vs. waiting? What's the projected 409A trajectory — does delaying increase the bargain element and the AMT hit?
Step 3: RSU Vest Disposition
Why third: RSU ordinary income is inescapable — it happens at vest whether you sell or not. The only decision is what to do with the shares post-vest. But the RSU vest income affects your marginal rate for Steps 4 and 5, so you need to know the vest schedule before making those decisions.
Questions to answer before each vest: Does selling add concentration risk? Does my marginal rate (including this RSU income) mean the LTCG rate I assumed in Step 1 is wrong? Do I have capital losses from Step 5 that change the sell/hold calculus?
Step 4: NSO Exercise Timing
Why fourth: NSO exercise creates ordinary income that stacks on everything above it. At this stage, you know your RSU income, your projected ISO exercise, and your QSBS position. You can now model what the NSO exercise does to your total ordinary income and marginal rate.
Key question: Does exercising NSOs this year vs. next year shift income between tax brackets in a way that saves money? If income is lumpy (a big bonus coming next year, or a planned real estate sale), spreading ordinary income events across years can matter.
Step 5: Tax-Loss Harvesting
Why fifth: Now that you know your total realized gains for the year (from Steps 1-4), you can identify losses in your portfolio to harvest against them. Capital losses offset capital gains dollar-for-dollar. Losses above your gains can offset up to $3,000 of ordinary income annually, with the rest carrying forward indefinitely.
Key window: December 1-15 is the practical window. Year-end trades settle in early January; you want settlement in the current tax year. After December 15, settlement risk increases.
Step 6: Retirement Contribution Sequencing
Why last: 401(k) and IRA contributions are valuable but have the least interaction with the steps above. Max your 401(k) regardless ($24,500 in 2026; $32,500 if 50+). Then evaluate mega backdoor Roth capacity based on what's left in your annual additions limit. Backdoor Roth IRA if appropriate (see the Roth Worthiness Test). HSA if eligible ($4,300 individual / $8,550 family in 2026 — verify). These are mechanical steps once the decisions above are resolved.
The Interaction Effects
Here's where most people — and most advisors treating each instrument in isolation — leave money on the table.
Interaction 1: RSU ordinary income pushes LTCG into higher rate
Long-term capital gains rates depend on total taxable income. In 2026, the 0% LTCG rate applies up to ~$94,000 (single) / ~$188,000 (MFJ). The 15% rate applies up to ~$519,000 (single) / ~$583,000 (MFJ). The 20% rate applies above that. If your RSU vesting adds $80,000 in ordinary income, it can push $80,000 of your LTCG from 15% to 20% — a $4,000 additional tax that seems invisible until you see the interaction.
Interaction 2: ISO bargain element creates AMT that partially offsets regular tax
When you exercise ISOs, the bargain element is an AMT preference item. But AMT paid in one year creates an AMT credit that carries forward and can be used in future years when regular tax exceeds AMT. The question isn't just "does this ISO exercise create AMT?" — it's "does the AMT I pay now get recovered in future years, and over what time horizon?"
Interaction 3: NIIT triggers at income thresholds that multiple instruments can cross
NIIT (3.8% on net investment income) applies above $200,000 (single) / $250,000 (MFJ). These thresholds are not indexed to inflation — they're fixed, meaning bracket creep is real. If W-2 income + RSU income already pushes you above these thresholds, all investment income (dividends, capital gains from QSBS sale in non-conforming state, interest) gets hit with an additional 3.8%.
Interaction 4: Capital losses from TLH offset QSBS gains in non-conforming states
In California, QSBS gains aren't excluded. But capital losses can still offset them. If you have a $500,000 QSBS gain that's excluded federally but taxed in CA, and you have $100,000 in harvested capital losses, those losses reduce your CA-taxable QSBS gain by $100,000 — saving ~$13,300 in CA state tax. Coordinate your TLH specifically against QSBS gains in non-conforming states.
A Worked Example
Sarah, 38. Senior Director of Engineering, $450K W-2 income. Lives in California.
// Sarah's 2026 equity events
W-2 income: $450,000
RSU vest (4 events, Q1-Q4): $90,000
ISO exercise (3,000 shares, $10 strike, $45 FMV): $105,000 AMT preference
QSBS shares (year 5, $600K gain, federal excluded): $600,000 CA-taxable
TLH available from prior year losses: $80,000
// Without coordination: ~$198,000 total federal + CA tax
// With Decision Stack applied: ~$151,000 total — $47K savings
The $47,000 difference came from four coordinated decisions:
QSBS first: Confirmed year-5 eligibility and documentation in September. Executed sale in October before RSU Q4 vest.
ISO in low-income month: Exercised ISOs in October after confirming AMT exposure was within this year's AMT exemption with her current income. Created manageable AMT credit carryforward rather than current-year AMT.
TLH against CA QSBS gain: Harvested $80,000 in losses specifically against the California-taxable QSBS gain. Saved $10,640 in CA tax (13.3% × $80,000).
RSU Q4 same-day sale: With TLH done, Q4 RSU vest elected same-day sale to take cash and avoid concentration risk above 15% employer stock.
FAQ
Do I need a CPA or can I do this myself?
The framework above gives you the questions to ask and the order to resolve them. The specific calculations — AMT exposure, NIIT thresholds, state tax interaction — require your specific numbers. A CPA who specializes in equity compensation is worth the cost for one session in Q3 (September-October) to model the full year before you execute any transactions. The December rush is too late to change most decisions.
What if I have equity from multiple companies?
Apply the stack to each company's instruments, then consolidate the interaction effects. The priority order is the same — QSBS holding period decisions first across all companies, then ISO AMT planning across all companies, and so on. The interaction effects compound when you have multiple sources, which is exactly why treating them in isolation is so costly.
When should I start this analysis each year?
By September 1. That gives you October for QSBS and ISO decisions, November for RSU and NSO coordination, and December 1-15 for tax-loss harvesting. People who start in December can only execute Step 5. People who start in September can execute all six steps in the right order.
NettWorth
Wondering how to act on the insights in the article? Click here to apply this framework to your own wealth portfolio.
NettWorth reads your actual documents and applies what you just learned to your specific accounts, balances, and timeline — not a hypothetical.
No charge if you cancel. Your data stays yours.
Continue Reading
Concentrated Position Paradox: Managing Single-Stock Wealth Risk
Conviction vs. concentration risk: when 30% of net worth is in one stock, behavioral lock-in clouds every financial decision. Master diversification without abandoning company belief.
What AI Lab Employees Are Actually Doing With Their Equity
S has $3.2M in unvested equity at a major AI lab and genuinely doesn't know what to do. Not because she's unsophisticated — because nobody around her is being honest. Three camps, one clear pattern, and what peer data actually solves here.
Locked In Twice: RSU Concentration When You're Also on a Visa
Arun had $900K in unvested RSUs and 60 days to find a new H1B sponsor. His liquid net worth was $140K. Job loss and immigration risk are perfectly correlated for H1B workers — and the standard RSU playbook doesn't account for this.