Stealth Wealth Threshold: Spending Levels That Stall Wealth
Quick Answer
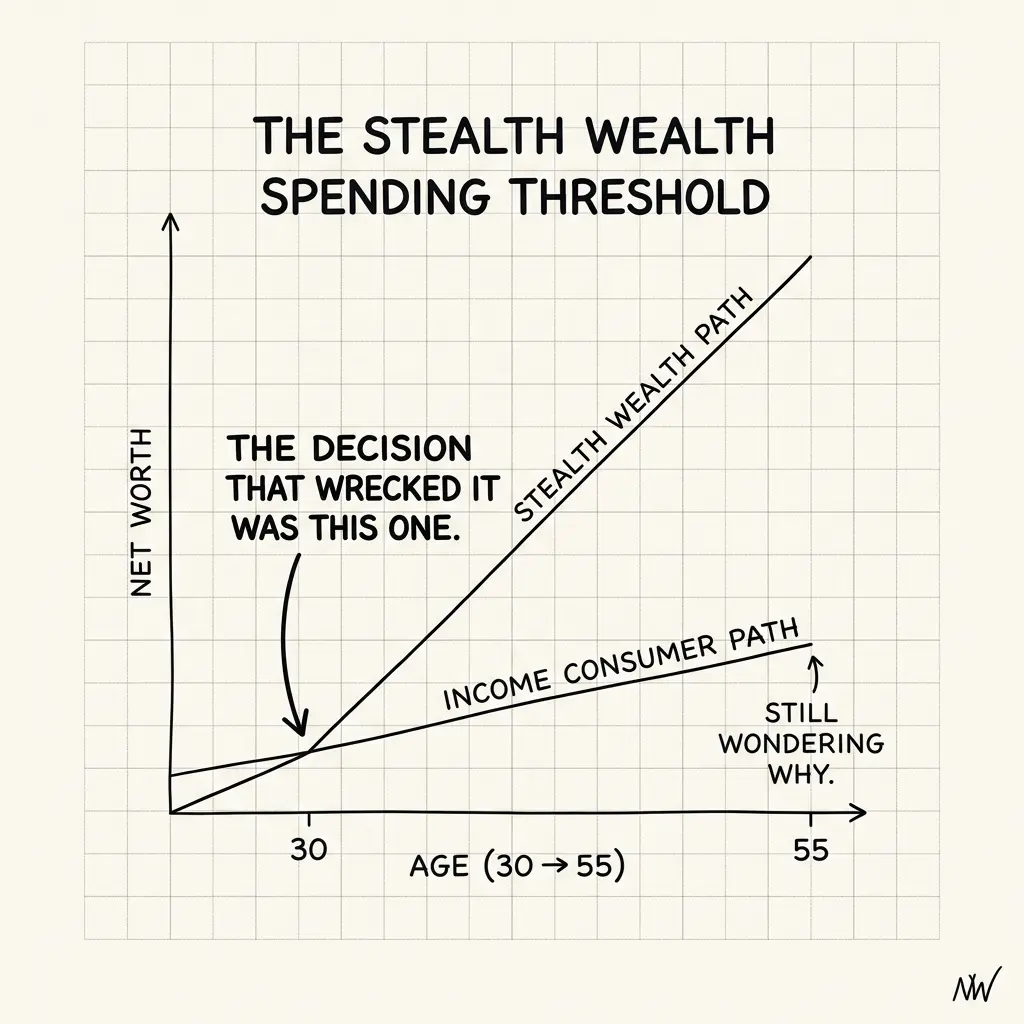
The Stealth Wealth Spending Threshold is the point where your income and actual spending patterns diverge visibly from your peer group. For $400K earners, that threshold is around $180K–$220K in annual spending. Spend less than $180K/year, and you live "stealth wealth" style—the surface looks normal, but your net worth compounds rapidly. Spend more than $220K/year, and spending creeps up to match income. The data shows: most HENRYs are unaware of where they fall on this spectrum. Knowing your true spending versus peer spending is the first step to optimizing it.
You earn $420K/year. Your colleague, also $420K, just bought a $3.8M house. You're still in your $2.1M house. You drive a 2019 Honda. She drives a new Range Rover. By every surface metric, she looks wealthier. By every financial metric, you're on track to be worth 2.5x more than her in 15 years.
The Stealth Wealth Spending Threshold describes this paradox: the point at which your actual spending behavior (and visible consumption) visibly separates from your peer group, even though your income is identical. Understanding where you fall on this spectrum—and what your peers spend—is crucial for making intentional financial decisions.
The Distribution of Spending at $400K Income
Federal data (NBER Household Survey, 2023) shows the range of annual spending among $400K+ earners:
Bottom Quintile (20%): $90K–$140K/year
These are your "stealth wealth" peers. They earn $400K+ but spend less than 35% of income. Most don't realize how low their spending is. (They think they spend normally.) Their net worth will reach $10M+ by age 60 without extraordinary effort.
2nd Quintile (20–40%): $140K–$180K/year
Moderate spenders. Still below income by a meaningful margin. Good schools, nice neighborhoods, but not premium homes. Net worth trajectory: $4M–$6M by age 55.
Middle Quintile (40–60%): $180K–$280K/year
This is where the spending threshold exists. Spending is visible but not conspicuous. Housing costs 25–35% of income. Peer signaling becomes noticeable (house size, school choice). Net worth trajectory: $2M–$3.5M by age 55.
4th Quintile (60–80%): $280K–$380K/year
High spenders. Spending is now correlated with income visibly. Housing is $2.5M+. Vacations are luxury. Service subscriptions multiply. Net worth trajectory: $1.5M–$2.5M by age 55.
Top Quintile (80–100%): $380K–$550K/year
Income and spending are nearly matched. After taxes (~$140K on $420K), most net income is spent. Typically includes $3M+ homes, luxury cars, premium services, international travel. Net worth trajectory: $900K–$1.8M by age 55.
The key insight: The bottom 40% of $400K earners—those spending under $180K/year—will end up with 2.5–3x more net worth than the top 40%, despite identical income. The spending threshold is the inflection point.
Why the Threshold Matters: The Lifestyle Anchoring Effect
The spending threshold matters because it's where spending becomes locked in. Below the threshold, you're still mobile. Above it, you're anchored.
Housing Anchoring (The Primary Driver)
For a $420K earner with $200K take-home after taxes, the house choice defines spending. A $2.1M house (4% down payment is $84K; with taxes, insurance, maintenance = $30K/year) is "sustainable." A $3.8M house ($36K down; $60K/year in carrying costs) requires the full income to service. The house isn't just an expense; it's an anchor that pulls up all other spending to match.
Once you're in the $3.8M house, you can't easily move to the $2.1M house. Your peer group has upgraded. Your sense of "normal" shifts. You're locked in.
Peer Effect (Social Comparison)
Your income is identical to your colleagues. When they upgrade to $3.8M houses, it creates a reference point. You now think "Everyone in my cohort is there." (They're not—only 40% are. But you notice the 40% more than you notice the 60%.) This anchors your aspirations upward.
Data: HENRY cohorts (people earning $300K–$600K) experience 4–6% annual upward drift in housing expectations, regardless of income stability. The peer group effect is powerful.
Subscription Creep (The Invisible Threshold)
Once you're in the $3.8M house, the spending surfaces: private schools (+$30K/year), luxury cars (+$15K/year), housekeeping (+$18K/year), personal trainer (+$8K/year), premium travel (+$20K/year). None of these individually "require" $3.8M house income, but they cluster. The threshold is where you have enough income that these subscriptions become affordable.
Each subscription feels like a small decision. Collectively, they create a spending floor. You can't unbundle them without social friction.
What You Actually Spend vs. What You Imagine
Most HENRYs dramatically underestimate their spending. When asked "How much do you spend annually?" most guess $150K–$180K. Actual tracked spending is usually $240K–$320K.
The Spending Blindspot
People track some expenses well (mortgage, car payment, obvious subscriptions) but miss others entirely (bonus-funded trips, annual upgrades, family gifts, unreimbursed business expenses, insurance policy upgrades). The gap between perceived and actual spending is 20–40%.
Until you run a 12-month analysis of credit card, debit, and cash spending, you don't know your true threshold. Most HENRYs won't do that analysis, which means they're optimizing against their imagined spending, not their real spending.
The Spending Categories That Define the Threshold
For $400K earners, the threshold is defined by these 6 categories:
1. Housing (Mortgage/Rent, Taxes, Insurance, Maintenance)
Below threshold: $18K–$28K/year. Above threshold: $45K–$70K/year.
2. Education (Private Schools + Tutoring + Camps)
Below threshold: $0–$8K/year (public schools or older kids). Above threshold: $28K–$60K/year (private K–12).
3. Vehicles + Transportation
Below threshold: $6K–$12K/year (paid-off cars, public transit). Above threshold: $20K–$35K/year (luxury cars, monthly payments).
4. Dining + Entertainment + Travel
Below threshold: $12K–$18K/year. Above threshold: $35K–$60K/year (luxury vacations, regular fine dining).
5. Services (Housekeeping, Personal Training, Lawn Care, Childcare Aides)
Below threshold: $0–$6K/year. Above threshold: $30K–$50K/year.
6. Insurance + Financial Services + Subscriptions
Below threshold: $8K–$12K/year. Above threshold: $18K–$28K/year (premium insurance, advisor fees, multiple subscriptions).
Adding these up: Below threshold = $44K–$74K base spending. Add food, utilities, clothing, healthcare = $110K–$150K total. Above threshold = $150K–$250K base spending. Add discretionary = $240K–$350K total.
The Questions That Matter
What's your actual annual spending (12-month tracked average)?
If you don't know, you can't optimize. Run a 12-month analysis first.
What percentage of your income is that?
If 40% or less, you're below the stealth wealth threshold. If 60%+, you're above it. 40–60% is the boundary zone where decisions matter most.
Which category is largest: housing, education, or services?
That category defines your spending floor. It's where you're most anchored. You can adjust discretionary spending, but that category is locked in.
Could you spend 20% less without social friction?
If no, you're above the threshold and locked in. If yes, you have flexibility to optimize.
The Intentional Choice
The Stealth Wealth Spending Threshold isn't a moral judgment. It's a data point. Some HENRYs choose to spend above the threshold because they value the lifestyle they get (larger house, private school, services that free up time). That's a valid choice.
But most don't choose it consciously. They drift above the threshold because:
1. They don't know the threshold exists
Most HENRYs don't have peers below the threshold. They don't see that people can live on $150K/year and still feel wealthy. They assume spending scales with income.
2. They don't track actual spending
Without tracking, they optimize against imagined spending ($150K) and don't realize they're drifting toward actual spending ($280K). By the time they notice, they're anchored.
3. They don't see the long-term cost
$100K/year in extra spending feels manageable now. Over 20 years, that's $2M in forgone wealth. Most people don't make that calculation.
The threshold isn't destiny. It's a choice point.
Once you know your spending level relative to peers earning the same income, you can make conscious decisions. Stay below the threshold and accelerate wealth. Cross it intentionally and enjoy the lifestyle benefits. But don't cross it by accident because you didn't know it existed.
If you don't know what your peers earning $400K actually spend—
You're not making a spending choice. You're defaulting into one. Data first, then decision.
NettWorth
Wondering how to act on the insights in the article? Click here to apply this framework to your own wealth portfolio.
NettWorth reads your actual documents and applies what you just learned to your specific accounts, balances, and timeline — not a hypothetical.
No charge if you cancel. Your data stays yours.
Continue Reading
HENRY Wealth Gap: What $400K Earners Really Accumulate
Federal data: top earners ($450K+) accumulate $1.6M by age 55, but 60-70% is illiquid. Discover where your wealth actually sits and the liquid wealth gap most HENRYs face.
Net Worth by Age Charts Are Wrong
The SCF benchmark is the most rigorous household wealth dataset in the US — and it doesn't count your EPF, your Hyderabad apartment, your unvested RSUs, or your NRE FDs. For cross-border HENRYs, the standard benchmark is measuring the wrong person.
What Your Financial Adviser Refuses to Show You
Dev asked his adviser how his returns compared to similar clients. The adviser changed the subject. Dev asked again the next quarter. Same thing. Then Dev realized: the adviser doesn't want that conversation — not because performance is bad, but because the comparison raises questions the model can't answer profitably.