HENRY Wealth Gap: What $400K Earners Really Accumulate
Quick Answer
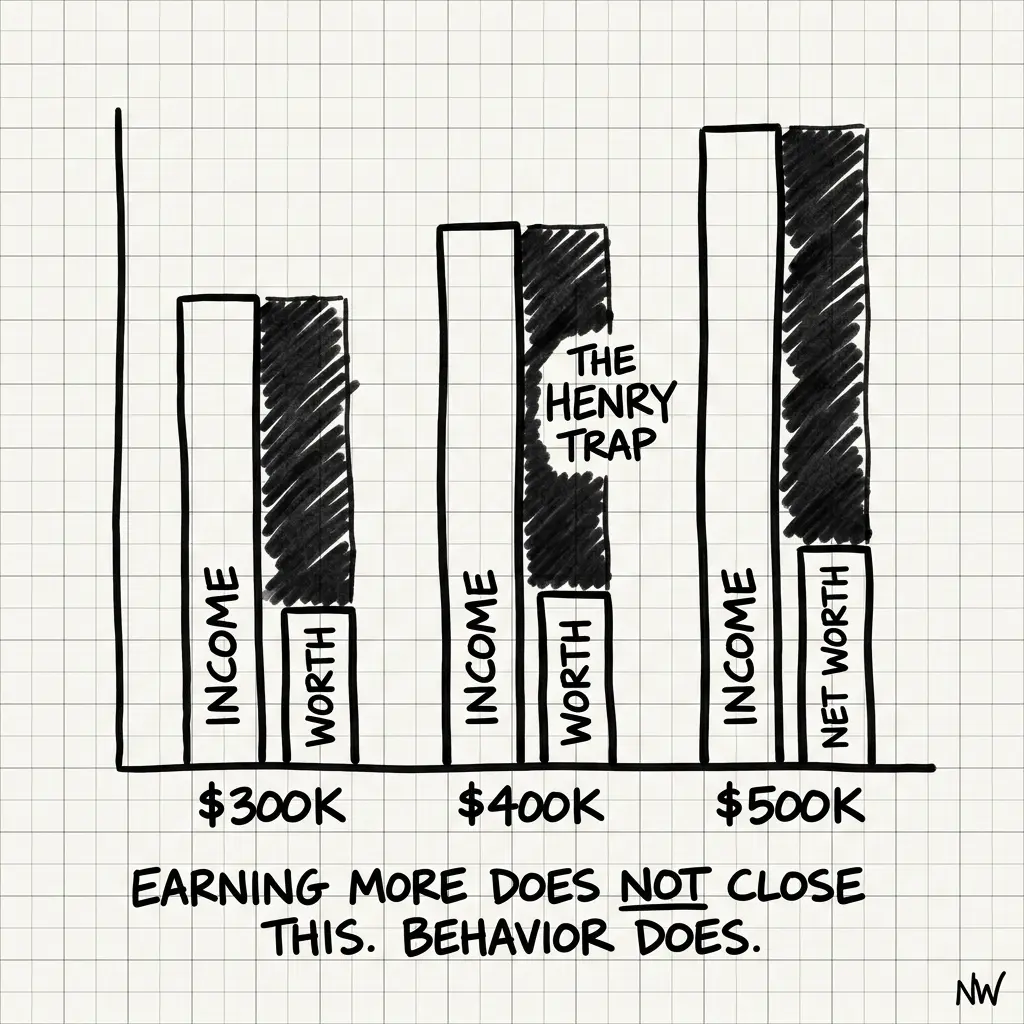
The HENRY Wealth Gap is the chasm between income and accumulated wealth at the $300K–$600K income level. Federal data shows a top-quintile earner ($450K+ household income) accumulates a median net worth of $1.6M by age 55. Sounds high until you realize: that's 60%–70% locked in primary residence, leaving only $480K–$640K in liquid assets. The real wealth gap isn't between HENRYs and the wealthy—it's between HENRYs and themselves. Your income suggests $3M+. Your net worth suggests something smaller.
She makes $500K a year. By every financial metric, she's in the top 2% of earners. But when she sits down with her spreadsheet, her net worth doesn't match the story she's been told about herself.
Let's build her profile from public data. She's representative of what the Federal Reserve's Survey of Consumer Finances actually shows:
Age: 45. Household Income: $500K (both working)
Combined income from W-2 work, some equity comp, and side income. Top 2% of earners nationally. This puts her in an economic category where she should feel established.
Housing: $2.8M primary residence in a coastal market
Purchased $1.8M, added a remodel, now valued at $2.8M. Equity: $1.2M (after a $1.6M mortgage). The home is an asset, but it's also where she lives. Not liquid. Not deployable for opportunities.
Liquid Assets: $850K spread across 8 accounts
401(k): $320K. Brokerage: $280K. Cash: $150K. Real estate investment platform: $100K. This is what's actually available. It feels substantial until you realize: that's 1.7 years of gross income. For someone age 45 with 20 years until retirement.
Net Worth: $2.05M (1.2M home equity + 850K liquid)
Sounds solid. Top percentile. But here's the actual composition: 58% of that is locked in primary residence. Only 41% is actually liquid. Only 1% is sitting in cash (emergency fund or dry powder).
She's $500K in income but $850K in liquid wealth. That gap is the HENRY Wealth Gap.
Why the Gap Exists
The gap isn't because she's bad at saving. By any standard metric, she's doing well. The gap exists because of how wealth actually accumulates at this income level:
1. Lifestyle Inflation at the Margin
A person earning $100K can save 25% of income (relatively painless). A person earning $500K finds saving 25% much harder. Why? Each step of the income ladder brings new demands: better schools (higher housing costs), international vacations, higher quality childcare, private sports coaching. The denominator grew, but so did the denominator of expenses.
Data: The average savings rate for the top income quintile is 8–12%. For our $500K earner, 10% savings = $50K/year gross. After taxes (~$150K), net income is $350K. Savings is $35K/year. That's competitive but not exponential.
2. The Tax Drag
Federal income tax, state income tax (CA, NY, MA), FICA, and Medicare all add up. At $500K household income, effective tax rate is 32–42% (depending on state). That's $160K–$210K going to taxes. The marginal value of an additional $100K in income is maybe $58K–$68K after tax.
But wealth building requires after-tax dollars. The gap between gross income and available wealth-building capital is substantial.
3. Housing Cost Trap
A person earning $500K in a coastal market faces housing prices that assume a $500K income. A $2.8M house is justified: "It's where we need to live for schools / work / family." That house then consumes 40% of net income (mortgage, taxes, maintenance, insurance). The housing cost is optimized to the income level, leaving less for other wealth building.
The consequence: 58–70% of net worth locked in primary residence. That's normal at this income level. It's also a constraint.
4. Concentrated Asset Illusion
For tech workers, a meaningful portion of net worth is concentrated in a single stock: the employer's equity. If 20% of liquid assets are in one company stock, the *effective* diversified portfolio is smaller. The risk profile is skewed.
Diversifying concentration requires selling, which triggers capital gains tax. So concentrated holdings stay concentrated longer than they should.
5. Deferred Optimization
At $500K income, you should be optimizing everything: tax strategy, estate planning, asset protection, charitable giving, and wealth transfer. But these optimizations require professional guidance. And professional guidance at this level costs $15K–$50K/year.
The cost of not optimizing is high ($20K–$50K/year in tax leakage alone). The cost of doing it is also high. Many HENRYs choose inertia.
The Real Benchmarks
Here's what Federal data actually shows for the top income quintile:
Age 35, Household Income $400K+
Median net worth: $600K. That's 1.5x household income.
Age 45, Household Income $450K+
Median net worth: $1.6M. That's 3.5x household income. But 60% is home equity.
Age 55, Household Income $500K+
Median net worth: $2.4M. That's 4.8x household income. But 55% is still home equity.
Age 65+, Household Income was $500K+
Median net worth: $3.2M. But liquidity crisis emerges: how to draw from home equity without selling?
Notice the pattern: The net worth multiples look good. But the liquidity stays constrained. A $500K earner at age 55 with $2.4M net worth has maybe $1M–$1.2M in liquid assets. That's still under 2.5x gross income.
What Most People Get Wrong
People compare HENRYs to the general population and conclude: "You're doing great. Top 2%. Plenty of money." True in aggregate. False at the lived experience level.
The real problem: HENRYs compare themselves to other HENRYs and feel behind. Your peer just bought a $4M house. Your peer's net worth is $5M. Meanwhile, you're at $2M and wondering if you're on track. That comparison is toxic because it ignores the actual distribution. You're probably closer to the median HENRY than you realize.
If your wealth crosses borders, the gap can run the other way.
If you came to the US from somewhere else, the standard analysis quietly undercounts you. The Survey of Consumer Finances measures US households. It has no column for the apartment your family holds back home, the retirement account you've paid into since before you landed, or the inheritance everyone in your family knows is coming but nobody writes down. So your spreadsheet shows the US balance sheet: constrained, illiquid, behind your income, while a real share of your net worth sits in a country your planning tools don't have a field for.
Foreign assets are hard to value, harder to convert, and easy to leave off the page precisely because they're inconvenient. People anchor their whole sense of "am I on track" to a number that's missing a third of what they own. You're not necessarily behind your US peers. You might be ahead and not counting it. The work is the same either way: get the whole picture onto one page, in one currency, before you judge the gap.
The Gap Becomes a Constraint
The HENRY Wealth Gap becomes a real problem when it constrains decisions:
- Career risk: You're anchored to income because you need it to service the lifestyle. The gap means you can't easily take a step down, a sabbatical, or a risk that reduces income even temporarily.
- Liquidity stress: A major expense (medical emergency, business failure, job loss) forces you to liquidate concentrated holdings or take on debt. The gap means you don't have enough liquid reserves.
- Opportunity cost: A career move that requires geographic relocation (and thus a home sale) triggers capital gains tax you might not be able to afford. The gap means you're less mobile.
- Retirement unknowns: You have 20 years until retirement. But your liquid wealth suggests you'd need to keep working longer or downsize housing. That mismatch creates anxiety.
The Questions That Matter
What percentage of your net worth is locked in primary residence?
If it's 50%+, that's normal for your income level. But it's also a constraint. Knowing the number matters.
What's your ratio of liquid assets to gross household income?
For HENRYs, 1.5–2.5x is normal. If you're under 1.5x, you're tighter on liquidity than most. If you're over 2.5x, you're doing better than median.
How much of your liquid assets are in a single company stock?
If it's 20%+, you're running concentration risk without intending to. If it's 10%, you're doing better than most HENRYs with equity comp.
If your income stopped today, how many years could you maintain your current lifestyle?
If the answer is less than 3 years, the gap is a real constraint. If it's 5+, you have more cushion than you realize.
The Path Forward
The HENRY Wealth Gap isn't solvable by earning more. You're already in the top 2%. The constraint isn't income. It's composition.
Bridging the gap requires three moves:
1. Make Housing Decisions Intentional
Don't buy the house your income "justifies." Buy the house your net worth supports. That creates a delta. The delta compounds.
2. Build Liquid Buffers Explicitly
The gap persists because every dollar gets allocated: house, taxes, lifestyle. Carving out a liquid reserve (1–2 years of expenses in accessible form) requires a deliberate choice. Make it.
3. Optimize the Tax Drag
At $500K income, tax optimization (QSBS, TLH, charitable bunching, entity structure) can free up $15K–$40K/year. That compounds. Most HENRYs leave this on the table.
The gap exists because you're caught between two worlds: wealthy enough to face legitimate tax and planning complexity, but not wealthy enough to ignore the drag of taxes and lifestyle. You're at the threshold where intelligence about structure actually matters.
Your income is in the top 2%. Your liquid wealth shouldn't feel constrained.
Closing the gap is about composition, not earnings. It's solvable. But it requires seeing the gap first.
She makes $500K a year. By the numbers, she should feel secure. Instead, she feels caught. That gap is real. It's the HENRY Wealth Gap.
Your income says you're wealthy. Your balance sheet says you're still building. Closing that gap is the work.
FIRE Calculator
Calculate how many years until you reach financial independence and can retire. See your path to the numbers that actually matter.
If you earn $300K–$600K and feel wealthier on paper than in reality—
You're not behind. You're experiencing the HENRY Wealth Gap. Understanding it is the first step to closing it.
NettWorth
Wondering how to act on the insights in the article? Click here to apply this framework to your own wealth portfolio.
NettWorth reads your actual documents and applies what you just learned to your specific accounts, balances, and timeline — not a hypothetical.
No charge if you cancel. Your data stays yours.
Continue Reading
Stealth Wealth Threshold: Spending Levels That Stall Wealth
For $400K earners, spending above $180K-$220K annually stalls wealth growth. Federal data: bottom spending quintile accumulates 10x more wealth. Find your threshold and optimize.
Net Worth by Age Charts Are Wrong
The SCF benchmark is the most rigorous household wealth dataset in the US — and it doesn't count your EPF, your Hyderabad apartment, your unvested RSUs, or your NRE FDs. For cross-border HENRYs, the standard benchmark is measuring the wrong person.
What Your Financial Adviser Refuses to Show You
Dev asked his adviser how his returns compared to similar clients. The adviser changed the subject. Dev asked again the next quarter. Same thing. Then Dev realized: the adviser doesn't want that conversation — not because performance is bad, but because the comparison raises questions the model can't answer profitably.